

Bring the numbers. Get the analysis, not just a chart.
Your spreadsheet already holds the answer — getting it out is the work. Drop the Excel or CSV into YouWare and its Data Analytics expert team cleans it, runs the numbers, charts them, and writes the read. Formulas survive the export, and every figure shows the cells behind it.
Trusted by 1M+ creators. Featuring integrations from:

From raw rows to a decision
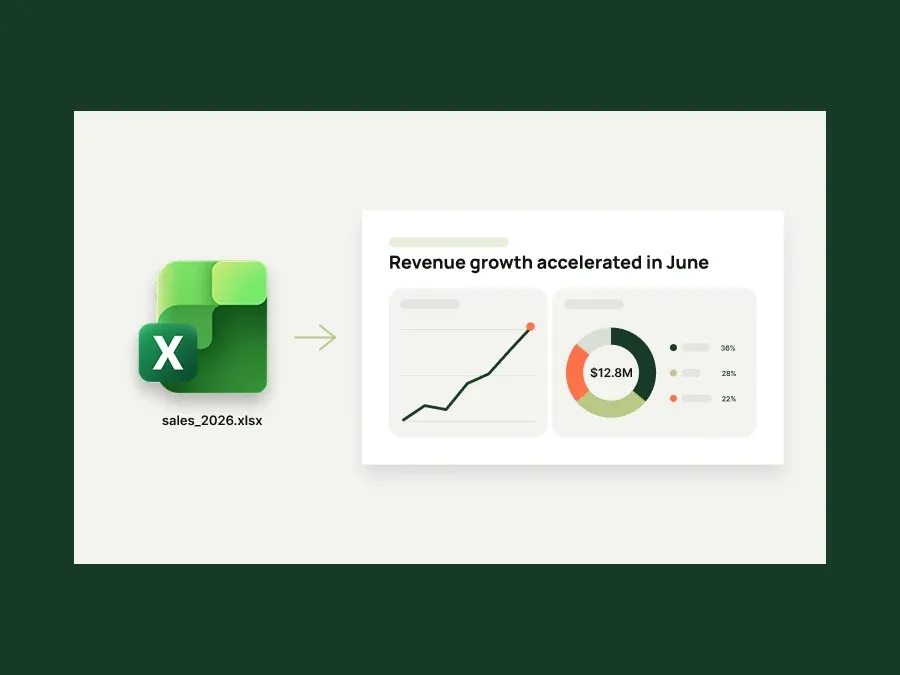
Sales data to a reportable deck
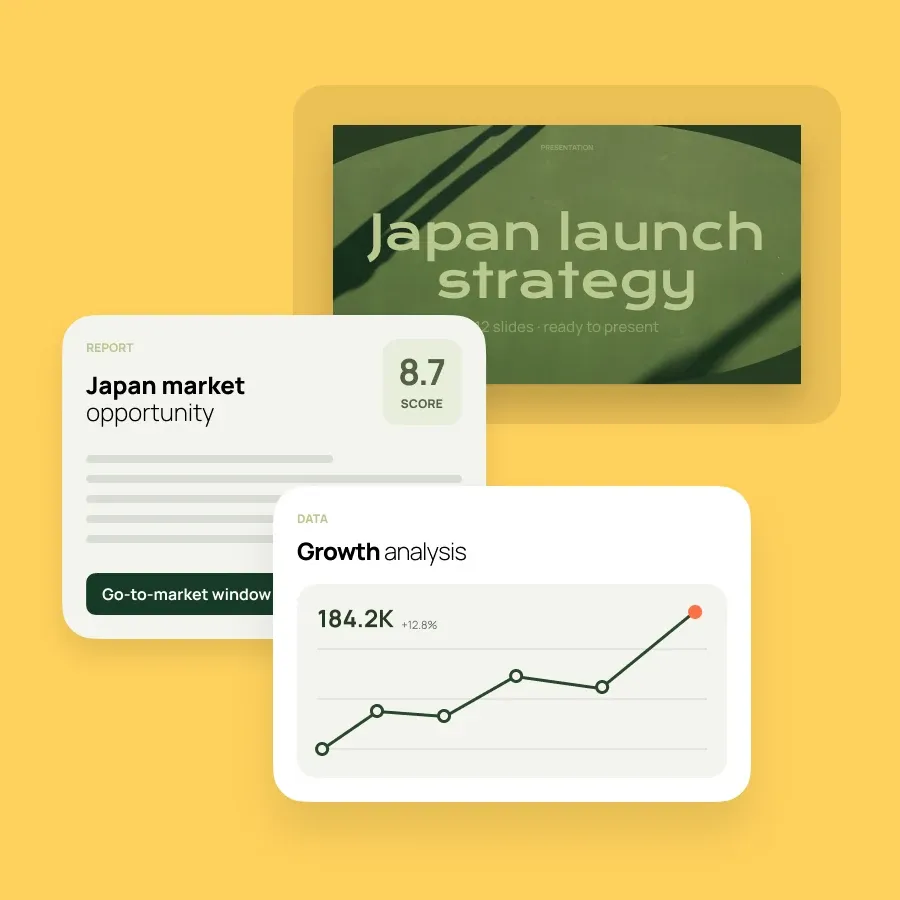
You have the export; your manager wants the story. YouWare cleans the data, charts the trend and the channel mix, writes the read, and hands you the deck — upload to presentable in one pass. Built for growth and BD teams who report numbers every single week.
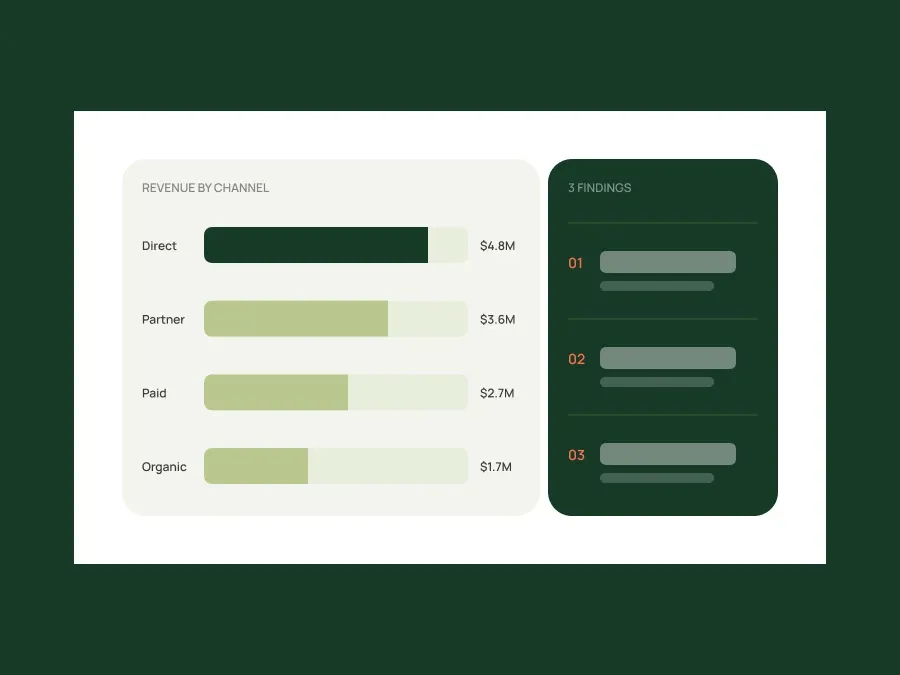
Channel review
Four ad platforms with four different column names. YouWare normalises them first and shows you the mapping it chose, so you can correct it before anything is computed. Out comes spend and CPM by channel, plus three findings written in plain language.
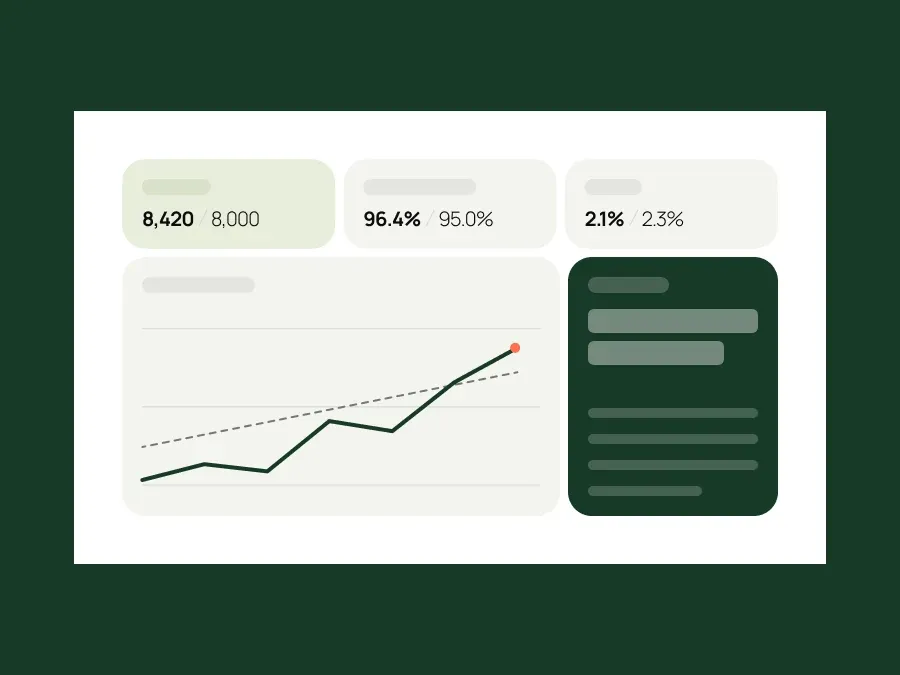
Operating KPI dashboard
Fourteen months of monthly metrics in; a KPI view with trend, target gap, and a one-page summary out. Formulas survive the export, so next month you refresh the file instead of rebuilding it from scratch.
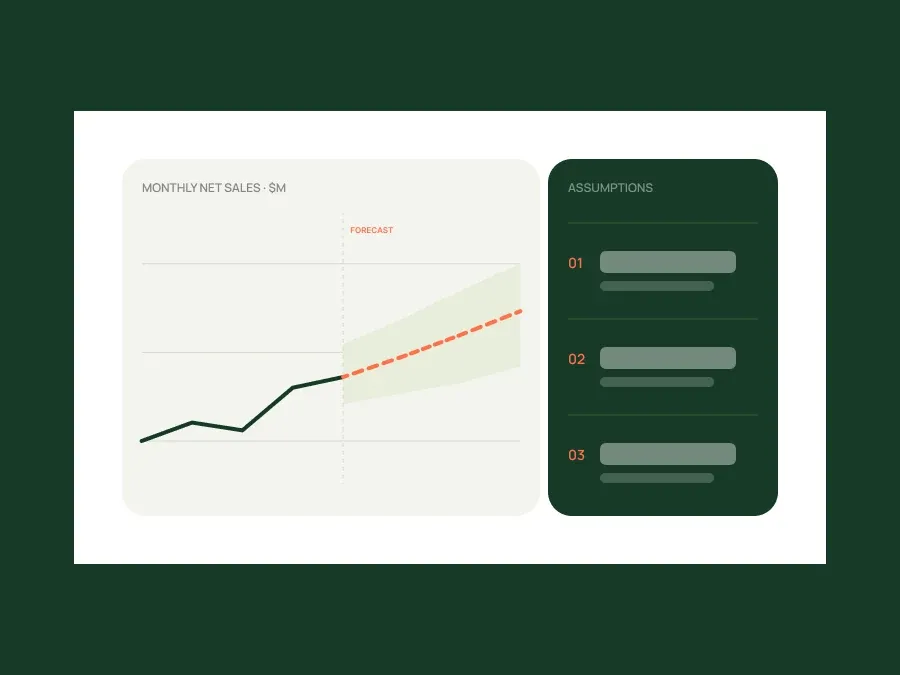
Sales forecast
Two years of orders and a pipeline sheet become a forecast with the assumptions written out and a sensitivity range beside it. Those assumptions are editable rows, not values buried in a formula — so when your VP disagrees, you change one cell, not the model.
Why this AI data analysis is worth presenting

Pick the expert team, not a blank prompt
Choose the Data Analytics team and its specialist Agents split the work: cleaning, computation, chart choice, writing, and a numeric review. One lead holds the question and signs off, so you get an answer rather than a pile of charts.

The file goes back into Excel
Export the .xlsx and your formulas are still there. Charts open as native Excel charts with their data ranges attached, so you can extend a series or fix a label. Share the summary as a link, or turn the same analysis into a deck in one click.
One brief instead of five rounds
A single brief covers the cleaning, the computation, the charts, and the write-up — rather than re-prompting until the numbers look right and then rebuilding the workbook by hand. What you review is an analysis, with the cells behind every figure.
The analysis, not just the chart.
Describe what you need and an expert team builds it — editable, sourced, and ready to share.
No setup · Editable output