ConnectAI at MWC 2026: Building Intelligent Network Monitoring Dashboards for Non-Engineers

Key Takeaways
MWC Barcelona 2026's ConnectAI track highlights how AI is transforming network operations, yet 57% of telecom executives cite talent shortages as the biggest barrier to AI adoption. Building network monitoring dashboards traditionally costs $35,000-$75,000 and takes 8-16 weeks with specialized developers. YouWare enables non-engineers to create intelligent network monitoring dashboards through natural language prompts in approximately 30 seconds, democratizing access to AI-powered network visualization without coding expertise.
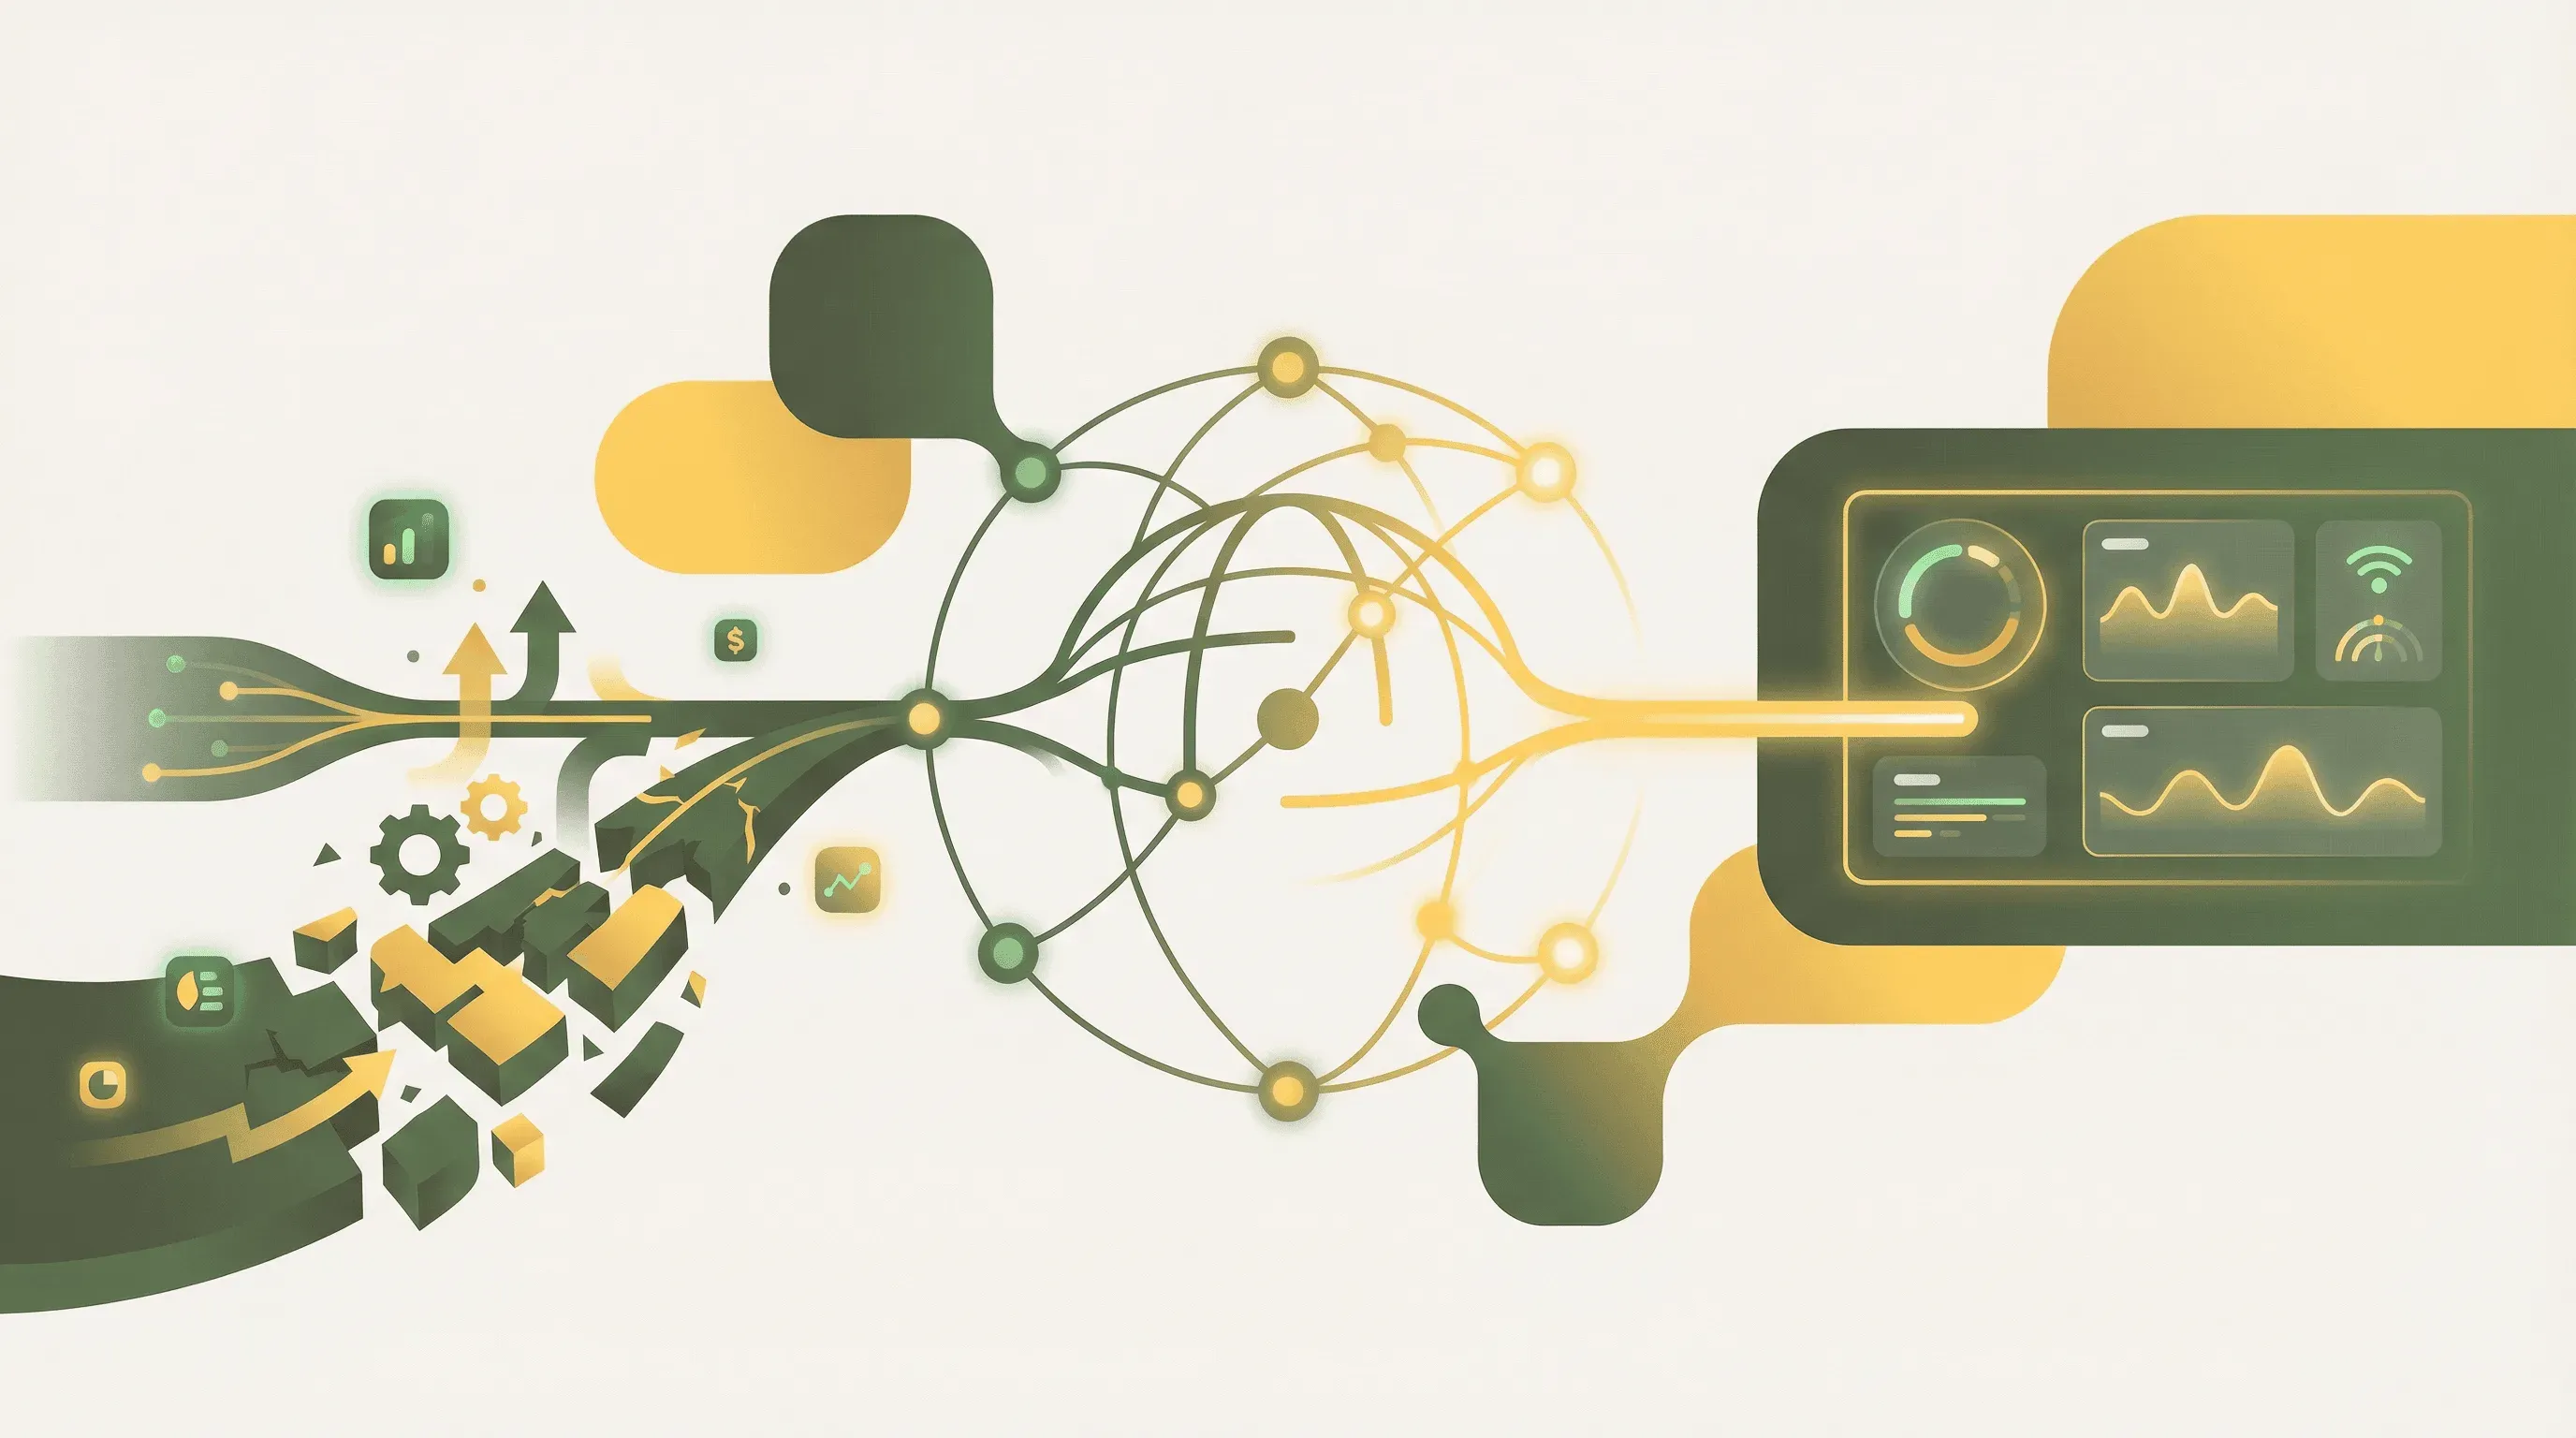 ConnectAI at MWC 2026 brings AI-powered network automation to the forefront of telecom innovation
What is ConnectAI at MWC 2026?
The ConnectAI track at MWC Barcelona 2026, sponsored by HONOR, represents one of the most significant gatherings of telecommunications innovation focused on AI-driven intelligent networks. According to the GSMA MWC 2026 Themes, this track examines how artificial intelligence is automating network planning, slicing, and operations—including self-optimizing radios, predictive cybersecurity, and agentic AI systems capable of autonomous decision-making.
The convergence of AI and network automation has reached an inflection point. Major industry players are showcasing groundbreaking solutions: Ericsson's Intelligent Automation Platform ranked #1 by ABI Research for 5G RAN Automation, while Ciena is demonstrating an AI agent builder—an OSS-native, low-code environment empowering customersto create AI agents with access to prebuilt tools, data, and APIs.
 MWC Barcelona 2026 showcases the convergence of AI and network automation — Source: Pexels
The implications are clear: the telecom industry is rapidly moving toward autonomous, self-optimizing networks. However, a critical gap remains—how can network operations teams visualize and interact with these AI-powered insights when building dashboards typically requires specialized developers they don't have?
The Challenge: Network Monitoring Dashboard Development Gap
Network Operations Centers (NOCs) sit at the heart of modern telecommunications infrastructure. They process millions of data points daily—latency measurements, packet loss statistics, bandwidth utilization, security alerts, and AI-generated predictions. Yet the tools to visualize this information often lag behind the sophistication of the data itself.
According to Sphere Global Solutions, AI integration can reduce NOC downtime by up to 40% and significantly improve network KPIs such as latency and packet loss while reducing operational expenses. The challenge isn't generating these insights—it's making them accessible to the people who need them most.
 Modern network operations centers generate vast amounts of data requiring sophisticated visualization — Source: Pexels
The NOC as a Service market reflects this growing demand. According to MarketsandMarkets, the market was valued at $3.73 billion in 2025 and is projected to reach $6.14 billion by 2030, growing at a 10.5% CAGR. This growth signals the industry's recognition that network monitoring capabilities must evolve—but the path forward requires solving the dashboard development bottleneck.
Network operations managers find themselves in an impossible position: they understand their data needs intimately but lack the technical skills to build the visualization tools they require. Meanwhile, their IT departments are overwhelmed with higher-priority projects, leaving monitoring dashboard requests in perpetual backlogs.
Traditional Dashboard Development: Time, Cost, and Skills Barriers
The economics of traditional dashboard development create significant barriers for network operations teams. According to Find Anomaly's analysis, enterprise-level dashboard development costs between $35,000 and $75,000 or more, with project timelines spanning 8-16 weeks when using traditional development approaches.
These figures assume you can even find the developers to hire. Professional dashboard services deliver production-ready dashboards 2-3x faster than internal teams building their first dashboard, according to the same analysis—but this premium comes at a cost that puts sophisticated monitoring solutions out of reach for many network operations teams.
 Traditional dashboard development requires extensive coding expertise that many telecom teams lack — Source: Pexels
The technical requirements compound the challenge. Building a network monitoring dashboard requires expertise across multiple domains: frontend development for visualization components, backend development for data processing, database design for storing historical metrics, API integration for connecting to network telemetry systems, and security implementation for protecting sensitive operational data. Few individual developers possess all these skills, which means dashboard projects often require entire teams.
| Development Approach | Cost Range | Timeline | Skill Requirements |
|---|---|---|---|
| In-house Development | $35,000-$75,000+ | 8-16 weeks | Full-stack team |
| Professional Services | $50,000-$100,000+ | 4-8 weeks | External contractors |
| No-Code Platforms | $0-$50/month | Minutes to hours | Natural language |
The contrast is stark. While AI can now predict network failures with 90% accuracy according to Gitnux's telecom statistics, the teams responsible for acting on these predictions often wait months for the dashboards that would make this information actionable.
The Telecom Talent Crisis: 57% Skills Gap Barrier
Beyond cost and time, the telecom industry faces a fundamental human resource challenge. According to Gitnux, 57% of telecom executives identify lack of skilled talent as the biggest barrier to AI adoption. This isn't a minor inconvenience—it's an existential challenge for an industry where 89% of executives agree that AI is critical to their long-term strategic survival.
The demographics tell a concerning story. According to Salience Consulting, in the UK, 60% of telecom engineers are now over 50 years old, with just 3% under 35. This aging workforce creates an urgent knowledge transfer challenge: the engineers who understand network operations deeply are approaching retirement, while the developers who could build modern monitoring tools are in short supply across all industries.
 The telecom industry faces a critical shortage of developers who can build network monitoring tools — Source: Pexels
The broader technology sector compounds this challenge. According to InfoTech Lead, the technology talent gap widened to 44% in 2025, with the telecom sector experiencing a 45% gap across advanced roles including 5G/6G engineers. Dice reports that 50% of all U.S. tech job postings required AI skills by 2025, further fragmenting the available talent pool.
The math is unforgiving: telecom companies compete for developers against every other industry undergoing digital transformation, while simultaneously needing more specialized skills than ever before. According to the U.S. Labor Department via RCR Wireless, the global shortage of software engineers may reach 85.2 million by 2030. Waiting for traditional hiring to solve the dashboard development problem simply isn't viable.
From Level 0 to Level 5: The Journey to Autonomous Networks
Understanding the dashboard visualization needs of modern telecom requires understanding where the industry is headed. The Telecommunication Management Forum (TM Forum) has defined a framework for network autonomy levels, ranging from Level 0 (manual operations) to Level 5 (full autonomy). Each level brings different monitoring and visualization requirements.
Huawei's ADN Level 4 solution won the Autonomous Network Operations award at FutureNet World 2025, demonstrating that Level 4 autonomy—where networks execute complex closed-loop operations with minimal human intervention—is becoming reality. The visualization requirements at this level shift from reactive monitoring to predictive oversight and exception handling.
 Network infrastructure complexity demands intelligent monitoring solutions at every autonomy level — Source: Pexels
The performance improvements from AI-driven automation are substantial. According to Gitnux, AI-driven network slicing reduces latency by 40% on average, while self-organizing networks (SON) with AI cut optimization cycles by 70%. AI optimizes radio access network (RAN) energy use by 30% in live deployments. These metrics require real-time visualization to track performance improvements and identify areas needing attention.
| Autonomy Level | Human Role | Dashboard Requirements |
|---|---|---|
| Level 0-1 | Manual execution | Basic metrics display |
| Level 2-3 | Approval authority | Recommendation interfaces |
| Level 4 | Exception handling | Predictive analytics, anomaly highlighting |
| Level 5 | Strategic oversight | Business outcome tracking |
Wind River's Edge AI for autonomous networks at MWC 2026 features real-time analytics, intelligent orchestration, and self-healing capabilities. As networks become more autonomous, dashboards must evolve from displaying raw metrics to presenting AI-interpreted insights that help human operators focus on the exceptions that require their judgment.
How No-Code Platforms are Transforming Dashboard Development
The convergence of AI capabilities and no-code development platforms offers a solution to the telecom dashboard challenge. According to Gartner via ByteIota, by 2026, 75% of new enterprise applications will utilize low-code platforms, with 80% of users outside traditional IT departments—up from 60% in 2021.
This shift represents more than incremental improvement; it's a fundamental change in who can build software. Forrester projects the global low-code market will approach $50 billion by 2028, driven by enterprises seeking to close the gap between business needs and IT capacity.
 No-code platforms empower non-engineers to build professional network monitoring dashboards — Source: Pexels
The telecom industry is already embracing this trend. Ericsson's Intelligent Automation Platform features both pro-code and low-code development capabilities with generative AI assistance. Ciena's AI agent builder provides an OSS-native, low-code environment. The message from industry leaders is clear: the future of network operations tooling includes platforms that non-developers can use effectively.
For network operations teams, this means the possibility of building custom dashboards without waiting for developer availability. The network engineer who understands exactly what metrics matter can now describe those requirements in natural language and see them implemented in real-time.
Building Intelligent Network Dashboards with YouWare
YouWare enables network operations teams to build intelligent monitoring dashboards through natural language prompts. Rather than writing code, users describe what they want—and YouWare generates complete, functional web applications in approximately 30 seconds.
The workflow for creating a network monitoring dashboard is straightforward. A network operations manager can describe their needs conversationally: "Create a dashboard showing real-time latency metrics, packet loss percentages, and bandwidth utilization across our core network segments, with alerts when any metric exceeds threshold values." YouWare's AI interprets this request and generates a complete application with data visualization components, real-time update capabilities, and alert logic.
YouWare's YouBase database integration provides the backend infrastructure network dashboards require. The Database module enables persistent storage of historical metrics with natural language queries—no SQL expertise needed. The Time Travel feature allows operators to restore dashboard data to any previous state, valuable for investigating past network incidents. The Users & Authentication module enables role-based access control critical for telecom compliance requirements, supporting email login, Google OAuth, and temporary accounts for different access scenarios.
For connecting to network telemetry systems and AI analytics platforms, YouWare's MCP integrations provide secure API connectivity. The Secrets module stores API keys with enterprise-grade encryption, ensuring credentials for network monitoring tools and AI services never expose to frontend code. This security architecture meets the standards telecom operators require for production systems.
The visual editing mode allows network operators to customize dashboard layouts, colors, and components after initial generation. Combined with the Boost feature for one-click AI optimization of user experience, teams can iterate rapidly on their dashboards without returning to developers for every change.
Step-by-Step: Creating Your First Network Dashboard
Here's how a network operations manager might build an intelligent monitoring dashboard with YouWare:
Step 1: Define Your Requirements Start by describing your dashboard needs in plain English. For example: "Build a network operations dashboard with real-time graphs showing latency, jitter, and packet loss for each network segment. Include a status panel with green/yellow/red indicators based on configurable thresholds, and a table showing the top 10 current alerts sorted by severity."
Step 2: Enable Backend Infrastructure In YouBase, enable the Database module to store historical metrics and threshold configurations. Enable the Users & Authentication module to control who can access the dashboard and who can modify alert thresholds. Enable the Storage module if you need to handle log file uploads or report exports.
Step 3: Configure Secure Integrations Add your network monitoring system API credentials to the Secrets module. Whether you're connecting to Prometheus, Grafana data sources, SNMP collectors, or proprietary telemetry APIs, YouWare keeps these credentials secure while enabling your dashboard to pull live data.
Step 4: Refine Through Conversation Continue the conversation with YouWare's AI to add features: "Add a time range selector that defaults to the last hour but allows viewing the past 24 hours, 7 days, or 30 days. Include export buttons for CSV and PDF reports."
Step 5: Customize Visually Use visual editing mode to adjust colors to match your organization's branding, resize chart components for optimal information density, and reorganize layout elements without touching code.
Step 6: Publish and Share Click Publish to deploy your dashboard with a shareable URL. Configure access controls so only authorized team members can view the dashboard, while designated administrators can modify threshold settings.
MWC 2026 Exhibitors Leading Intelligent Network Innovation
The ConnectAI track features multiple exhibitors demonstrating how AI transforms network operations. Understanding their approaches provides context for where the industry is heading—and what visualization requirements will emerge.
Netcracker is demonstrating ground-breaking Agentic AI use cases at MWC 2026 that deliver measurable value across every aspect of the telecom business, from autonomous network operations to customer experience. Their focus on agentic AI—systems that can take autonomous actions rather than just providing recommendations—represents the frontier of network automation.
FusionLayer's PRIMEA platform enables operators to enhance network performance by up to 20% without additional hardware investments. Their predictive analytics can optimize future RAN investments by up to 30%. These capabilities generate insights that network operations teams need to visualize and act upon—exactly the use case where rapid dashboard development becomes valuable.
 Collaborative teams can now build and iterate on dashboards without dedicated developers — Source: Pexels
The common thread across these exhibitors is that AI generates insights faster than traditional tools can display them. Self-optimizing networks make decisions in milliseconds, but human operators still need visibility into what's happening and why. This creates ongoing demand for visualization tools that can be built and modified quickly as AI capabilities evolve.
Best Practices: Designing Network Monitoring Dashboards Without Coding
Building effective network monitoring dashboards requires thinking carefully about what information matters most and how to present it clearly. Here are practical considerations for non-engineers creating their first dashboards:
Focus on Actionable Metrics First Start with the metrics that directly inform decisions. Latency, packet loss, and bandwidth utilization are universal, but your specific network may have additional critical indicators. Resist the temptation to display every available metric—information overload reduces dashboard effectiveness.
Design for Glanceability Network operators often monitor dashboards while handling other tasks. Use color coding consistently (green for normal, yellow for warning, red for critical), position the most important information in the upper-left quadrant where eyes naturally land first, and use visual hierarchy to distinguish between overview panels and detail sections.
Build in Historical Context Real-time data gains meaning from comparison with historical patterns. A latency spike that looks alarming might be normal for that time of day. Include trend lines, sparklines, or comparison with previous periods to help operators distinguish genuine anomalies from expected variation.
Plan for Mobile Access Network issues don't wait for business hours. Design dashboards with responsive layouts that work on tablets and smartphones, enabling on-call engineers to assess situations from anywhere. YouWare's visual editing mode makes it straightforward to adjust layouts for different screen sizes.
Iterate Based on Usage The first version of any dashboard is a hypothesis about what information matters. Track which panels operators actually use, which alerts get acknowledged versus ignored, and what questions the dashboard doesn't answer. Use no-code tools to implement improvements quickly rather than waiting for development cycles.
The Future of Network Operations: Democratized Intelligence
The trends converging at MWC 2026 point toward a fundamental shift in how network operations teams work. According to Gitnux, 68% of global telecoms are already piloting generative AI applications. As these pilots mature into production deployments, the demand for visualization tools will only increase.
The telecom industry cannot wait for traditional development approaches to catch up with AI capabilities. With talent gaps widening and network complexity increasing, the operators who thrive will be those who empower their existing teams to build the tools they need. No-code platforms like YouWare make this possible by translating domain expertise into working applications without requiring coding skills.
The democratization of dashboard development doesn't replace specialized developers—it frees them to focus on the complex integrations and custom algorithms that genuinely require their expertise. Meanwhile, network operations teams gain the ability to iterate on their own visualization tools, closing the feedback loop between insight and action.
As networks progress toward Level 4 and Level 5 autonomy, human operators will shift from managing routine tasks to overseeing AI decisions and handling exceptions. The dashboards supporting this new role will need to evolve continuously—a pace of change that traditional development cannot sustain. The organizations building their visualization capabilities on flexible, no-code foundations will be best positioned for this future.
FAQ
Can non-technical staff really build production-quality network dashboards?
Yes, modern no-code platforms have matured significantly. YouWare generates complete applications from natural language descriptions, including database backends, authentication systems, and API integrations. The key is starting with clear requirements and iterating based on feedback. Many organizations find that domain experts who understand network operations build more useful dashboards than developers who lack that operational context.
How do no-code dashboards handle real-time data updates?
YouWare supports real-time data through API integrations configured in the MCP connections and Secrets modules. You describe the data sources you want to connect, provide the necessary credentials securely, and the platform handles the technical implementation of polling or webhook-based updates. The YouBase database module provides persistent storage for historical data while supporting real-time queries.
What about security and compliance requirements for telecom environments?
YouWare's architecture addresses enterprise security requirements through several mechanisms. The Secrets module provides enterprise-grade encryption for API credentials, ensuring they never expose to frontend code. The Users & Authentication module enables role-based access control with email verification options. For organizations with specific compliance requirements, the platform's approach of generating standard web applications means the output can be reviewed and validated against security standards.
How does YouWare compare to traditional business intelligence tools like Tableau or Power BI?
Traditional BI tools excel at analyzing historical data across many dimensions but require significant setup and often separate data warehouse infrastructure. YouWare creates complete web applications that can include BI-style visualizations alongside interactive features, forms, and custom workflows. For network monitoring specifically, the ability to combine real-time metrics with alerting logic and operator response workflows in a single application often proves more valuable than pure analytical capabilities.
Can I migrate a no-code dashboard to traditional code later if needed?
YouWare generates standard HTML, CSS, and JavaScript that can be viewed and modified in the platform's code editor. Published projects can be connected to GitHub for version control and backup. While some advanced features require YouWare's infrastructure, the core application code remains accessible for organizations that want to transition to traditional development or integrate with existing systems.
Conclusion
MWC Barcelona 2026's ConnectAI track arrives at a pivotal moment for the telecommunications industry. AI capabilities are advancing rapidly—self-healing networks, predictive maintenance, autonomous optimization—but the tools for visualizing these insights haven't kept pace. The traditional approach of building dashboards through specialized development teams cannot scale to meet the demand, especially given the 57% talent gap barrier that telecom executives identify as their biggest challenge.
No-code platforms represent a practical solution to this bottleneck. By enabling network operations managers, field engineers, and NOC staff to build their own visualization tools through natural language, these platforms close the gap between AI-generated insights and human decision-making. The economics are compelling: minutes instead of months, minimal cost instead of $35,000-$75,000+, and iteration speed that matches the pace of AI advancement.
The future belongs to organizations that empower their teams to build the tools they need. YouWare provides the platform to make this possible—transforming natural language descriptions into complete, production-ready dashboards with real-time data, secure integrations, and enterprise authentication. The network intelligence is already there; now anyone can visualize it.

References
- GSMA MWC 2026 Themes
- Ericsson #1 Ranking in 5G RAN Automation - EuropaWire
- Ciena Autonomous Networking at MWC 2026
- AI and Automation in Network Operations Centers - Sphere Global Solutions
- NOC as a Service Market Report - MarketsandMarkets
- AI in Telecom Industry Statistics - Gitnux
- Wind River Edge AI at MWC 2026 - Yahoo Finance
- Netcracker at MWC 2026
- FusionLayer at MWC 2026 - Street Insider
- Huawei ADN Level 4 - FutureNet World 2025
- Gartner Low-Code Projections - ByteIota
- Forrester Low-Code Market Analysis
- Data Visualization Services Cost Analysis - Find Anomaly
- Telecom Talent Crisis - Salience Consulting
- Tech Hiring Trends 2026 - InfoTech Lead
- AI Skills in Tech Jobs - Dice
- Software Engineering Skills Gap - RCR Wireless